There are a couple different types of people in this world. If you’re visually inclined, then you’ll want to read my race report which has 29 pictures of the race. That’s one way to describe this brutal course. For those like me who need to quantify things a bit more finely, the below charts will do a better job of explaining exactly what you’ve gotten yourself into.
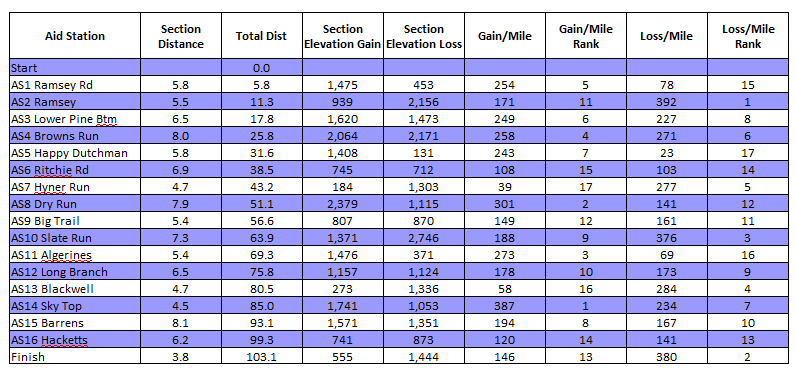
When thinking about hard sections of this course, I think the Gain/Mile Rank does a good job of objectively highlighting the most challenging sections. Now other sections may subjectively feel harder, but that could just be because you got dehydrated or haven’t been able to eat in a couple hours. Before I created the above table after this year’s race, I thought the sections into Sky Top and Dry Run were the hardest so it’s nice to see the numbers back me up on this. Dry Run felt a little harder because it was hotter out.
Digging down a little deeper into the elevation gain, the following chart details out the major climbs of along the course. Combined they represent about 2/3 of the total elevation gain so there’s still plenty of rolling terrain outside these hills.
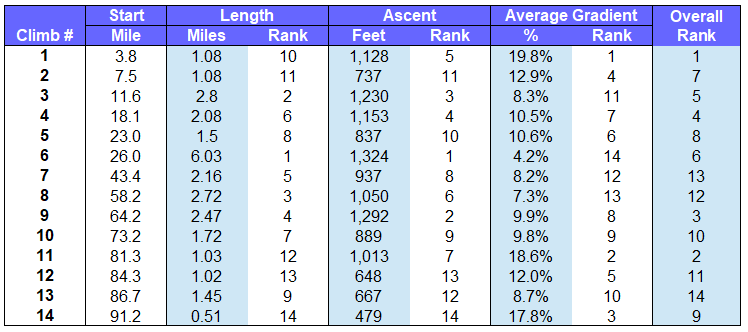
You’ll probably notice a large difference between the objective and subjective difficulty of the climbs as you go along. The 3rd and 14th hills are probably my least favorite. #3 because it seems to last forever with a never ending series of false summits. You also hit it right as it starts getting pretty hot out. This has been a devastating combination for me in years past. The last one because it’s ridiculously steep. And because it’s the last one. This will feel like the longest half mile of your life.
I’ve always thought the first half of the course was much harder than the second half, but I’m not sure the tables above back that up. You get 10,800 feet of elevation gain and half the major hills through Dry Run and then 9,700 the rest of the way. That’s probably as close to 50/50 as you’re going to get in a race.
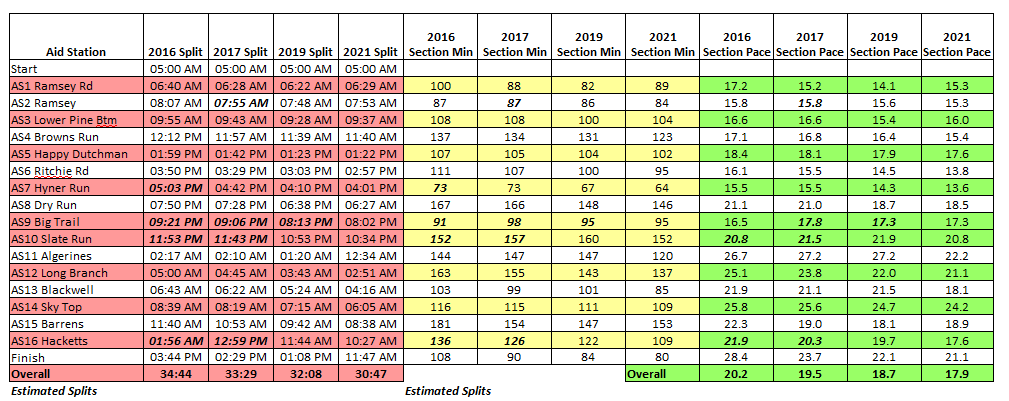
My 2016 splits are good to use if you only care about finishing. They are just fast enough to bank some time early on. This will let you basically walk it in from the halfway point, which is what I did, and still have an hour buffer. The key is to minimize time spent in aid stations and just keep moving forward. Even though you get 36 hours to finish, 15% of runners typically finish within the last hour. With 16 aid stations along the way, an extra 3 minutes in each will essentially blow your buffer.
Considering how great my race went this year, it’s difficult to find sections where I can pick up much more time. There’s probably 15-20 minutes in the last 3 sections; maybe half an hour from Big Trail into Blackwell. And there may be a couple minutes here or there in the first half of the race. Offsetting these would be that I spent relatively little time in aid stations this year, especially after Slate Run, and we had mild temperatures. So even though I’d love to run under 30 hours (as it’s a round number), I’m not sure that’s within my realm of possible.
Well, I guess there’s only one way to find out. See you next year!
Awesome job. I was a volunteer at AS7 and remember seeing you. Been following your blog for a while and hoping to be out there running the course next year. Congrats on a great race!
Thanks for the comment and thanks so much for volunteering! Good luck with your training and I’ll see you next year.